
Pumping Dry or Powering Up? India's Energy Security - A Decade-by-Decade Reckoning
- Vimarsh Padha

- Mar 28
- 10 min read
Updated: Mar 29
How seven decades of policy, global price shocks, and geographic realities shaped the current energy crisis?
Why This Moment Hurts
India is, structurally, one of the most energy-vulnerable major economies on Earth. It is the world's third-largest consumer of crude oil, importing nearly 87–88 percent of its consumption. It is also the fourth-largest importer of liquefied natural gas and the second-largest consumer of LPG - with roughly 45 percent of crude oil, 60 percent of natural gas, and over 90 percent of LPG imports originating from the Middle East.
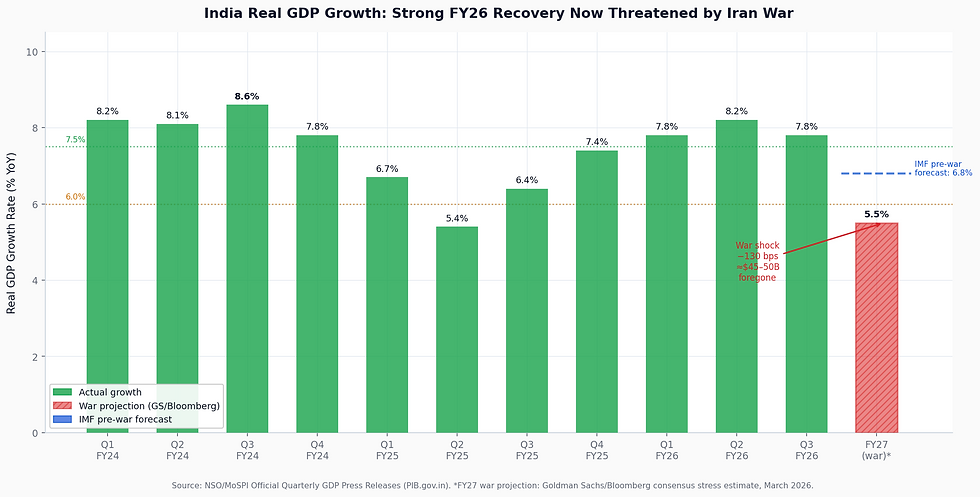
When the Strait of Hormuz closes - as it effectively has during the current Iran–US confrontation, over 1.6 million tonnes of crude oil, along with 320 thousand tonnes of LPG and about 200 thousand tonnes of LNG, become stranded aboard Indian-flagged vessels. Energy shortages begin rippling across petrochemicals, manufacturing, fertilizers, and household cooking gas.
Reuters · March 26, 2026: "Despite the situation at the Strait of Hormuz, India is today receiving more crude oil from its 41-plus suppliers across the world than what was previously arriving through the Strait." - India's Ministry of Petroleum & Natural Gas
That is the government's own statement in response to the crisis. India has secured 60 days of oil and fuel stocks — against a total storage capacity of 74 days, through emergency procurement from Russia, the United States, West Africa, and Australia. On LPG specifically, domestic daily production was ramped up 40 percent, and 800,000 tonnes of emergency cargoes were secured internationally.
But the crisis itself did not materialize from thin air. It is the compounding of structural choices - and structural inactions, made across seven decades and multiple governments. The question for a neutral observer is not "which party caused this?" but rather: Has the needle on energy security moved, in which direction, and under which government?
Key Numbers at a Glance (2026)
Metric | Value | Context |
Crude oil import dependence | 88.5% | FY2026 record high |
Renewable energy capacity | 220 GW | March 2025; world top-4 |
Strategic petroleum reserve | 9.5 days | vs IEA 90-day standard |
Crude supplier nations | 41+ | Up from 27 in 2006 |
Solar installed capacity | 106 GW | World #3 |
Russia's share of crude imports | 36% | Up from <1% in 2021 |
Current oil+fuel stocks secured | 60 days | Reuters/MoPNG, Mar 2026 |
Ethanol blending in petrol | ~20% | July 2025 |
The Long Arc: Seven Decades of Structural Fragility
Before comparing the UPA and NDA records, it is essential to understand what neither government could easily change: India's geology is unforgiving. The country has large sedimentary basins but modest proven reserves. Most accessible fields were discovered and brought into production decades ago — the landmark Mumbai High offshore discovery in 1974 raised hopes of energy independence that were never fulfilled. Fields are aging, costs of enhanced recovery are high, and new frontier exploration is inherently high-risk.
Key Milestones:
1956 — ONGC established; India's first organized national oil exploration drive
1974 — Mumbai High discovered; dreams of self-sufficiency that never materialized
1991 — Economic liberalization opens energy sector; imports begin rising structurally
1999 — Strategic Petroleum Reserve programme conceived; ground-level work begins years later
2004 — India begins importing LNG for the first time; a new strategic dependency born
2010 — Jawaharlal Nehru National Solar Mission launched; India's first major renewables push
2022 — Russia-Ukraine war; Indian refiners pivot sharply to discounted Russian crude
2026 — Iran–US war closes Strait of Hormuz; current energy crisis unfolds
India's net oil import dependency rose from about 12 percent in 1980 to over 34 percent by 2012 — and has now crossed 88 percent because demand has grown far faster than domestic production ever could. This is a secular trend, not a government-created one. But governments can accelerate or decelerate it, and that is what makes the comparison meaningful.
Key Macro Trends


The UPA Era (2004–2014): Governing Through a Price Storm
The Congress-led UPA government inherited a rapidly growing economy and faced something the NDA never had to contend with: a sustained period of brutal crude oil prices. The Indian oil basket averaged $112 per barrel in 2011-12 — the highest sustained price level in recorded history. This created an enormous fiscal and forex burden.
The Subsidy Architecture
The UPA's response was the Administered Price Mechanism — a tripartite subsidy system involving direct budget support, upstream company contributions, and oil bonds. During the UPA decade, the Union government collected ₹10.75 lakh crore in petroleum taxes and returned ₹8.56 lakh crore — approximately 80 percent — in subsidies to keep prices under control. Retail petrol prices were kept below ₹72 per litre through this mechanism.
UPA Fiscal Reality: The UPA subsidy architecture kept consumer prices artificially low but created a debt-laden ONGC, oil bonds inherited by the next government, and current account deficit pressure. It was a politically popular but fiscally costly approach - forced by a global price environment far outside India's control.
What the UPA Built (Often Overlooked)
$13.6 billion invested by Indian NOCs in overseas upstream assets before 2014 (equity oil security)
RGGVY (Rajiv Gandhi Grameen Vidyutikaran Yojana) launched 2005 - first major rural electrification scheme; ~2.16 crore BPL household connections
JNNSM (Jawaharlal Nehru National Solar Mission) launched January 2010 - set 20 GW target for 2022
SPR construction began - Vizag, Mangalore, Padur facilities initiated
India's domestic crude production peaked at 38 million tonnes in 2011-12 under the UPA era - and began declining thereafter. The KG basin gas discovery raised great expectations that were ultimately disappointed. Coal India's production consistently lagged government targets due to systemic issues - bureaucracy, land acquisition, and under-investment - resulting in power sector coal shortages and blackouts.
"The UPA governed through the worst price storm in oil history, chose subsidies over structural reform, kept a lid on consumer pain, but accumulated fiscal risk. Neither the best nor worst approach - it was crisis management, not energy sovereignty."

The NDA Era (2014–Present): Bold Targets, Lower Prices, Mixed Results
When the Modi government came to power in May 2014, global crude prices were about to collapse - from above $100/bbl to below $30 by early 2016. This was a structural global tailwind that no policy could have manufactured. The NDA government collected this windfall largely into government revenues rather than passing it through to consumers.
The NDA collected ₹44 lakh crore in petroleum taxes over a decade — returning only about ₹1.7 lakh crore (~4 percent) as subsidies, compared to the UPA returning ~80 percent. Whether this represents fiscal prudence or consumer burden depends on one's political lens - but the data is unambiguous.
The Stated Goal: Dramatically Missed
In March 2015, Prime Minister Modi urged energy sector stakeholders to reduce oil import dependence from 77 percent then to 67 percent by 2022, and further to 50 percent by 2030. In the 11 years since that speech, dependence has risen from 80.6 percent to 88.6 percent.
Unmet Target: India's 2015 NDA target: reduce crude oil import dependence to 67% by 2022. Actual result by FY2026: 88.5%, the exact opposite direction.
Why Domestic Production Kept Falling
The NDA passed a remarkable number of exploration policy reforms — HELP 2016, OALP, reduced royalty rates, zero revenue-sharing requirements, opening of offshore no-go zones, the Oilfields Amendment Act 2025. Over 170 blocks have been awarded. Yet domestic crude production fell 26 percent over the decade.
The honest explanation is structural: aging fields at Mumbai High and elsewhere are in terminal decline. ONGC was loaded with debt (~₹78,000 crore by 2024) partly from forced acquisitions — GSPC, HPCL — that constrained capital expenditure for actual exploration.
Where NDA Has Genuinely Delivered
Solar capacity: 2.6 GW (2014) → 106 GW (2025) — a 40-fold expansion; world #3
Total renewables: 34 GW (2014) → 220 GW (2025) — global top-4
Rural electrification: Saubhagya scheme electrified 28 million households (2017-2022)
Ethanol blending: <2% pre-2014 → ~20% by July 2025
Supplier diversification: 27 countries (2006) → 41+ countries (2025)
Gulf share reduction: ~72% (2017-18) → ~63% (2024)
On July 29, 2025, renewables met 51.5% of India's total electricity demand — a historic milestone

The Russia Equation: Clever Opportunism or New Concentration Risk?
One of the most dramatic structural shifts has been the Russia pivot. Before the Ukraine invasion in February 2022, Russia supplied less than 1 percent of India's crude. By 2024-25, it supplies approximately 36 percent — India's single largest crude supplier.
This was partially opportunistic: Western sanctions drove Russia to offer deep discounts to Asian buyers. Indian refiners pragmatically absorbed these discounted barrels, justified as serving citizens' economic interests. The strategy also strengthened India's position as a major exporter of petroleum products.
New Risk Created: India swapped an Iran concentration risk (eliminated by US sanctions) for a Russia concentration risk (now 36% of imports). India's refineries are also calibrated for Middle Eastern crude grades, making rapid sourcing switches technically constrained. The current crisis has required paying premiums of $2–8/barrel over Brent for Russian crude — far above the earlier discount era.
In the current Iran-US crisis, India has invoked a temporary US waiver to continue purchasing Russian crude and is simultaneously procuring emergency cargoes from the US, West Africa, and Australia. The minister confirmed non-Hormuz sourcing has risen to approximately 70 percent of crude imports.

Strategic Petroleum Reserves: India's Achilles Heel Across All Governments
India's dedicated SPR holds just 5.33 million metric tonnes, enough for approximately 9.5 days of crude consumption. Including commercial stocks, total coverage reaches 74 days. The IEA recommends a minimum of 90 days.
Global comparison:
Japan: 254 days
South Korea: 208 days
USA: 90+ days
China: ~125 days (estimated)
India (total including commercial): 74 days
India (SPR only): 9.5 days
Parliamentary Committee · March 2026: A Parliamentary Standing Committee on Petroleum and Natural Gas urged the government to increase crude reserves to meet 90 days of needs, stating this would strengthen energy security.
The SPR programme's history is a bipartisan story of delay. Conceived in the late 1990s, construction began in the mid-2000s, and the first facility became operational only in the 2010s. The NDA approved Phase-II expansion in July 2021 on a public-private partnership model. These remain incomplete. India's oil consumption grew 51 percent between FY2013-14 and FY2023-24, while SPR capacity remained at 5.33 MMT.

The Comparative Scorecard: Data, Not Rhetoric
Indicator | Pre-2014 (UPA) | Post-2014 (NDA) | Verdict |
Crude oil import dependence | 77–80% (rising) | 88.5% FY26 — record high | ▼ Worse |
Domestic crude oil production | Peaked 38 MT (2011-12) | 29 MT — fell 23% | ▼ Worse |
Crude supplier nations | 27 countries (2006) | 41+ countries (2025) | ▲ Better |
Gulf's share of crude imports | ~72% (2017-18) | ~63% (2024) | ▲ Better |
Russia's share of crude imports | <1% | ~36% — new concentration | ● Context |
Strategic petroleum reserves | ~5 days (built) | 9.5d SPR; 74d total | ▲ Better |
IEA 90-day benchmark met? | No | No (74d total, still short) | ▼ Worse |
Solar installed capacity | ~2.6 GW (2014) | 106 GW — world #3 | ▲ Better |
Total renewables capacity | ~34 GW (2014) | 220 GW — global top-4 | ▲ Better |
Ethanol blending in petrol | <2% | ~20% (July 2025) | ▲ Better |
Rural household electrification | ~84% villages by 2014 | ~100% HH; 28M added | ▲ Better |
Crude oil price environment | $100–145/bbl (storm) | $30–85/bbl (tailwind) | ● Context |
Crisis response: 60d supply | — (different context) | Secured (Reuters Mar 2026) | ▲ Responsive |
Where Does India Stand Today vs the World?
On renewables, India punches above its weight decisively. By November 2025, non-fossil fuel capacity crossed 51.5 percent of total installed electricity generation capacity. India ranks third in solar, fourth in wind, and fourth in total renewables globally — a genuine achievement.
On oil security, the picture is much weaker. The IEA projects India's oil demand to grow from 5.5 million barrels per day in 2024 to 8 mbpd by 2035, with import dependence rising to 92 percent. India will account for nearly half of global incremental oil demand growth over the next decade.
Global standing today:
Compared to its most relevant peers — Japan, South Korea, China — India lags significantly on reserve coverage, domestic production self-sufficiency, and infrastructure resilience. On renewables, India leads. The honest assessment sits between these poles.
The Verdict: Structural Failure is Bipartisan; Progress is Real but Incomplete
India's oil import dependence has worsened under every government since liberalization, because domestic geology and demand growth make it structurally inevitable in the medium term. No single government created this problem, and none has solved it.
The NDA era benefited from a major global oil price tailwind (prices roughly halved vs the UPA years) and built a genuine renewables revolution — arguably India's most significant energy achievement of the 21st century. It also oversaw meaningful supply diversification, ethanol blending scale-up, and universal household electrification. These are real and significant achievements.
However, the NDA also presided over continued domestic crude production decline (−23 percent), failed spectacularly to meet its own stated import-reduction target (67 percent by 2022; actual: 88.5 percent), did not meaningfully expand strategic reserves relative to rapid consumption growth, and created a new Russia dependency that carries its own geopolitical risks.
"The current crisis is neither caused purely by the present government nor absolvable by pointing entirely to global forces. It is the compounding of structural choices, and structural inactions - made across decades and multiple governments. The correct question is not who to blame, but what it would take to get India genuinely energy secure."
The immediate crisis response - 60 days of stocks secured, emergency LPG procurement from four continents, non-Hormuz sourcing raised to 70 percent - shows competent acute management. But the architecture that made the crisis inevitable in the first place - 88 percent import dependence, 9.5-day dedicated SPR, 90 percent LPG from one region - reflects long-term policy gaps that predate and extend through the current administration.
What a Genuinely Energy-Secure India Would Require
Regardless of which government is in power, the structural agenda is clear:
Expand SPR to at least 30–45 days (as an interim target toward 90 days)
Aggressively develop frontier offshore basins with genuine private sector participation
Accelerate the national gas grid to reduce oil dependence in industry and power
Push EVs and biofuels in transport at scale — the ethanol trajectory shows this works
Establish long-term LPG supply agreements with non-Hormuz suppliers
Maintain the renewables trajectory — it will gradually erode oil's role in power generation
The scorecard is mixed. The criticism is partially justified. The defense is partially valid. The structural challenge belongs to everyone , and its resolution will require sustained commitment far beyond any single government's tenure.
Data Sources & References
Ministry of Petroleum & Natural Gas (MoPNG) — Indian Petroleum & Natural Gas Statistics, various years
Ministry of New & Renewable Energy (MNRE) — Physical Progress Reports; PIB Press Releases (2025)
International Energy Agency (IEA) — World Energy Outlook 2025; India Country Analysis
Council on Foreign Relations — "Oil Energy, India-U.S. Relations, and the Russia Conundrum" (February 2026)
Reuters — "India secures 60 days of oil supply amid Hormuz disruption," Nidhi Verma (March 26, 2026)
EY India — "India's Energy Balancing Act" (February 2026)
Business Standard — "Why India's energy security goal is an unfinished journey" (March 23, 2026)
The Diplomat — "Gulf War 3.0: How Is India Securing Its Oil Supplies?" (March 2026)
South Asian Voices — "Risk and Resilience: India's Energy Security in a Volatile Middle East" (March 24, 2026)
GlobalData — "India's Crude Oil Import Recalibration" (February 2026)
IJFMR — "Crude Oil Imports in India: Trends and Transitions" (2025)
The Print — "India's strategic oil reserves tell a tale of structural constraints" (March 2026)
S&P Global Commodity Insights — "Striking the Balance: India's Energy Security" (2025)
IRENA — Renewable Energy Statistics 2025
U.S. Energy Information Administration (EIA) — India Country Analysis Brief (2024)
This analysis is prepared for informational purposes. All data points are sourced from government publications, peer-reviewed journals, and credible international organizations. No political position is taken.


Comments